.png)
Your agency posts hundreds of pieces of social media content every month across dozens of client accounts.
But do you actually know what's working? Tracking the right social media KPIs is the difference between guessing and growing — for your clients and your agency's bottom line.
This guide breaks down the exact social media engagement metrics you should track, how to analyze social media content effectively, and how to turn those numbers into client reports that prove your value.
No fluff, no vanity metrics; just the data that drives retention and revenue.
Contents
- Why tracking social media content performance matters for agencies
- The 5 social media KPIs every agency should track
- How social media engagement drives every other metric
- How to analyze social media content: a step-by-step workflow
- 7 social media stats that help agencies land more clients
- FAQ
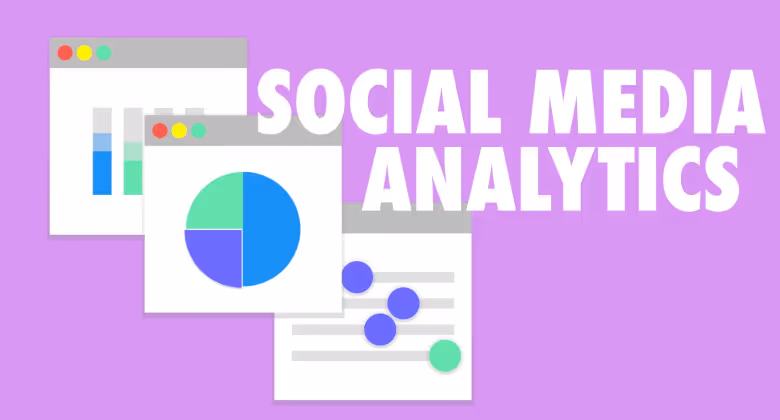
Why tracking social media content performance matters for agencies
Direct answer: Tracking social media content performance lets agencies prove ROI to clients, reduce churn, and make data-backed decisions about what to post next.
Social media analytics should be the cornerstone of every client strategy you run. Without them, you're flying blind — posting content and hoping it sticks.
When you track social media success consistently, you accomplish three things at once:
- Client retention: Reports with real numbers keep clients paying month after month.
- Operational efficiency: You stop wasting time on content types that underperform.
- Scalability: Clear content performance KPIs for client reporting let a small team manage dozens of accounts confidently.
The challenge for agencies isn't a lack of data. It's knowing which metrics actually matter when you're managing multiple brands at scale.
Agency tip: Build a standardized KPI dashboard template that you use across every client. This saves onboarding time and makes it easy for any team member to pick up an account.
The 5 social media KPIs every agency should track
Direct answer: The five essential social media KPIs for agencies are engagement rate, reach/impressions, click-through rate, conversion rate, and brand sentiment.
Not all metrics deserve equal attention. Here are the five that directly tie your social media content to business outcomes — organized from awareness to revenue.
1. Engagement rate
Engagement rate measures how actively an audience interacts with your social media content. It includes likes, comments, shares, and saves relative to reach or follower count.
This is the metric that tells you whether your content resonates. A post with 50,000 impressions but 12 engagements is a red flag. A post with 2,000 impressions and 300 engagements is a signal to double down.
Track engagement post by post and look for patterns:
- Which content formats (video, carousel, static image) earn the most interaction?
- Which topics spark comments versus passive likes?
- What time of day generates the highest engagement for each client?
Agency tip: Use engagement rate — not raw likes — when reporting to clients. It normalizes performance across accounts of different sizes, making your batch content creation for multiple clients easier to benchmark.
2. Reach and impressions
Reach counts unique viewers. Impressions count total views, including repeats. Together, they tell you how far your social media content travels.
High reach with low engagement means your content is being seen but not connecting. High impressions relative to reach means people are viewing the same post multiple times — a sign of strong content or effective paid amplification.
For agencies, reach and impressions are critical awareness metrics:
- They show whether you're expanding a client's audience beyond existing followers.
- A post with a significant number of shares will naturally extend reach to new potential customers.
- Tracking these over time reveals whether your content strategy is growing or stagnating.
3. Click-through rate (CTR)
CTR measures the percentage of people who clicked a link in your post after seeing it. It's the bridge between social media content and a client's website or landing page.
To calculate CTR, divide total link clicks by total impressions, then multiply by 100.
CTR matters because it directly connects social activity to business outcomes. A high CTR means your copy, creative, and call-to-action are aligned. A low CTR means something in the chain is broken — even if engagement looks healthy.
Tips for improving CTR across client accounts:
- Test different CTA placements and wording.
- Use UTM parameters on every link so you can attribute traffic accurately in Google Analytics.
- Compare CTR by platform to understand where each client's audience is most action-oriented.
Agency tip: When building your social media content calendar template for agencies, include a column for link destination and UTM tags. This small step makes ROI reporting dramatically easier at month-end.
4. Conversion rate and referrals
Conversion rate tracks how many people took a desired action — a purchase, a sign-up, a form submission — after clicking through from social media content.
Most marketers think "conversion" means a sale. But the conversion funnel has multiple stages worth analyzing:
- Social click to website visit: Did the ad or post drive traffic?
- Website visit to lead capture: Did the landing page convert?
- Lead to customer: Did the full funnel work?
Understanding where drop-offs happen helps you detect issues — whether it's weak creative, a broken landing page, or a misaligned audience. Referral traffic from social channels, tracked via UTM codes, gives you the data to connect the dots.
5. Brand sentiment and feedback
Brand sentiment goes beyond counting likes. It measures how people feel about your client's brand based on what they say in comments, reviews, and mentions.
Social listening tools are key here. They help you monitor:
- What people are saying about the brand across platforms.
- Whether the tone of mentions is positive, negative, or neutral.
- How sentiment shifts after campaigns, product launches, or PR events.
For agencies, tracking sentiment is a retention play. If you can surface insights like "customer sentiment improved 15% this quarter," you're delivering value that goes far beyond posting content.
Additionally, tracking response rates and reviews helps you stay on top of customer success. Clients whose audiences feel heard are clients who stick around.
How social media engagement drives every other metric
Direct answer: Engagement amplifies reach, improves CTR, and signals content quality to platform algorithms — making it the foundational metric for social media content performance.
Social media marketing isn't only about engagement. Most agencies optimize for link clicks or impressions. But engagement is the engine that powers both.
Here's why: when a follower likes, shares, or comments on a post, the platform extends that post to their network. More engagement means greater potential reach. It's a compounding effect.
Think of a post with zero engagement. It's siloed to existing followers. Now think of a post where 50 people share it. Each share introduces the content to an entirely new audience segment.
The second effect is social validation. Posts with visible positive feedback earn higher click-through rates. People trust content that others have already endorsed.
Using dynamic, varied social media content — mixing video, carousels, polls, and user-generated content — has been shown to significantly boost engagement rates. According to HubSpot's marketing research, video content generates roughly 1200% more shares than text and image content combined.
Agency tip: When you repurpose content across clients, don't just copy-paste. A social media content repurposing framework should adapt format, tone, and hooks for each brand's audience. Same insight, different execution.
How to analyze social media content: a step-by-step workflow
Direct answer: To analyze social media content effectively, establish baselines, categorize content by type, review KPIs weekly, generate ROI reports, and iterate your strategy based on data.
Analytics are only valuable if you can act on them. Here's a five-step agency social media content workflow for turning data into better results.
Step 1: Establish baselines per client
Before you can track social media success, you need to know where each client stands. Pull 30–90 days of historical data for:
- Average engagement rate per post
- Average reach and impressions
- CTR on link posts
- Follower growth rate
These baselines become your benchmarks. Without them, you can't measure improvement.
Step 2: Tag and categorize content by type
Not all posts are created equal. Categorize each piece of social media content by type so you can compare apples to apples:
- Format: Image, video, carousel, text-only, story
- Purpose: Educational, promotional, entertaining, user-generated
- Topic: Product feature, industry news, behind-the-scenes, testimonial
This tagging system powers your content performance KPIs for client reporting. When a client asks "what's working?", you'll have a clear answer.
Step 3: Review content performance KPIs weekly
Set a weekly cadence to review social media engagement metrics for each client. Look for:
- Which content types earned the highest engagement rate?
- Did any posts significantly outperform or underperform?
- Are reach and impressions trending up or down?
Weekly reviews catch problems early and let you pivot before a full month of underperforming content goes out.
Step 4: Generate client reports with ROI metrics
Your clients need to see the value you deliver. Build reports that include:
- Total engagement, reach, and impressions for the period
- Top-performing posts with explanations of why they worked
- ROI metrics like cost per engagement, cost per impression, and cost per follower
- Follower growth with percent change
In Cloud Campaign, you can generate a client report with a single click. Enter the date range, toggle advanced settings to include marketing spend, and share a branded, white-label report link directly with your client. The client content approval process and reporting live in one place — under your brand, not ours.
Step 5: Iterate your social media content calendar
Data without action is just noise. Use your weekly and monthly insights to update each client's social media content calendar:
- Double down on high-performing content types.
- Retire formats that consistently underperform.
- Test new approaches based on engagement patterns.
- Adjust posting times based on when each client's audience is most active.
This cycle — post, measure, learn, adjust — is what separates agencies that retain clients from those that churn them.
Agency tip: Use a white-label social media portal so clients can see their own analytics in real time. It builds trust, reduces "how are we doing?" emails, and positions your agency as transparent and professional.
7 social media stats that help agencies land more clients
Selling a new client is tough without numbers to back your claims. Use these stats in your next pitch:
- 80% of social network users prefer to connect with a brand over social media. Not being on social means potential customers won't put in extra work to find a business.
- Social media has a 100% higher lead-to-close rate than outbound marketing. Clients are more likely to close deals through social platforms.
- 79% of companies saw increased traffic from just 6 hours per week invested in social media marketing. Imagine what a dedicated agency team can accomplish.
- Users spend 33% of their internet time on social media. With billions of people online, the marketing opportunity is massive.
- Custom social media content can generate 3x as many leads as traditional marketing methods. More leads, more customers, more revenue.
- Generating leads on social media costs 62% less than traditional methods. Lower costs plus higher revenue equals better margins for your clients.
- 38% of marketers prefer social media for business communications. The informality of social platforms works especially well for B2C companies.
With all of these new clients you'll be onboarding, you need a social media management tool that scales with your agency.
Cloud Campaign is built to help you manage multiple brands from one dashboard — with white-label portals, automated reporting, and a client content approval process that keeps everything organized.
FAQ
What are the most important social media KPIs for agencies?
The five most important social media KPIs for agencies are engagement rate, reach/impressions, click-through rate (CTR), conversion rate, and brand sentiment. These metrics cover the full funnel from awareness to revenue and give you the data needed for client reporting.
How often should I review social media content performance?
Review social media engagement metrics weekly for each client to catch trends early. Generate formal client reports monthly or quarterly, depending on the client's expectations and contract terms.
How do I prove ROI on social media content to clients?
Track conversions, referral traffic, and cost-per-engagement using UTM parameters and your analytics platform. Include ROI metrics like cost per impression and cost per follower in client reports. Cloud Campaign lets you add marketing spend to reports so ROI calculations are automatic.
What's the difference between reach and impressions?
Reach counts the number of unique users who saw your post. Impressions count the total number of times your post was displayed, including repeat views by the same user. Both are important social media engagement metrics for understanding content visibility.
How can I scale social media analytics across multiple clients?
Use a platform built for agencies that supports white-label reporting, batch content creation for multiple clients, and centralized analytics. Standardize your KPI dashboard template so any team member can review any account without a learning curve.


Want to grow without expanding your fulfillment team?
CloudStudio helps agencies automate the technical grind of social media management so your team can spend less time posting and more time growing accounts. Reserve your spot now.
.png)


.png)


.avif)


.avif)


.avif)